Google Analytics is so widely used in marketing, and yet — honestly — remains profoundly misunderstood.
It is the proverbial answer to the “post-click” question. If you bought some media, what happened after the click? No ad platform will tell you properly, because no ad platform is built to see past its own traffic.
Yet, most GA4 configurations I see are still fully out-of-the-box.
We’re tagging everything, and still reporting on nothing
Tell me if this resonates. We're diligent about UTMs. Every newsletter, every social post, every partner link tagged like it's being squirrelled away for next Christmas.
Then you open GA4. You get a Traffic Acquisition report that shows channels. You get a Pages report that shows pages. What you really wanted was the two in the same table, and there's no obvious way to ask for it. So you export to a sheet, or you quote a blended number nobody can act on.

And the heat's on. The QBR is coming up. The boss has been pumping money into this initiative. Aren't you the analyst? The intern spent twelve hours on UTM tagging last week — where did it go?
The data is in there. The standard reports just won't show it to you by default.
I'm going to share what I think is the most criminally underrated tip in GA4. Secondary dimensions.
What are secondary dimensions?
As the name suggests, this allows you to populate a second level of segmentation on any report. A secondary dimension, if you will.
Reports in GA4 typically examine one dimension at a time.
- What does page-level performance look like?
- What channels is our traffic coming from?
The standard reports work fine for that. The problem is that almost nothing you actually want to know is a one-dimension question.
Marketing questions come in pairs
Think about the questions that come up in real client conversations.
- Out of this landing page traffic, what pieces of content are driving the most traffic?
- What channels are driving traffic to this page?
- Or inversely, what are our top performing pages on paid social?
Notice what those have in common. Every single one contains two dimensions. Page and channel. Content and traffic. Campaign and landing page.
That's the whole gap. Marketing questions are almost always two-part, and the standard reports are built to answer one part at a time. Secondary dimensions are how you reconcile the two.
How it's done
In any detail report, look at the table underneath the chart. The first column header is your primary dimension. Immediately to its right there's a small plus sign.
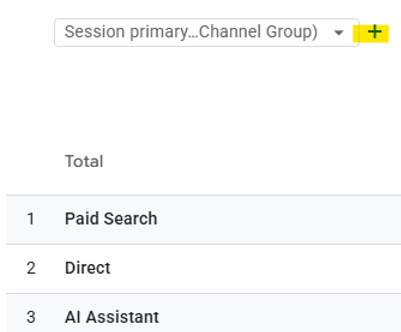
Click it and you get a searchable list of every dimension compatible with your primary. Pick one, and the table redraws with a row for every combination of the two.

Say in this example, we wanted to pair the campaign with each of our primary channels.
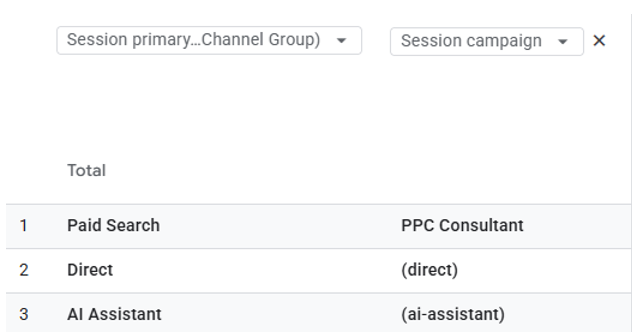
Voila. The data will now segment entirely against this second dimension.
Two things to know before you get attached to it…
- You only get one secondary dimension in standard reports - if you need three or four in the same view, that's what Explorations are for.
- It’s temporary. Navigate away and it's gone, there's no saving it in place. If you find something worth keeping, export it.
The bit almost nobody knows
Here's the genuinely obscure one.
In GA4's standard reports you cannot use a custom dimension as a primary dimension. The dropdown only offers a fixed set of defaults. This is why a lot of people register custom dimensions, go looking for them in the reports, can't find them, and conclude analytics must have inexplicably jettisoned them to one of Saturn’s moons.

It did work – that’s just the nuance. Custom dimensions are available as secondary dimensions.
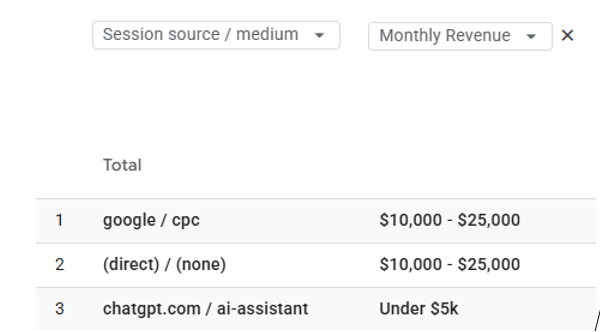
So everything your GTM setup is passing — logged-in status, customer tier, form type, content category — is sitting behind that plus button. Invisible until you go looking.
Pairings worth practising
Which channels are landing on this page? Landing page × Session source/medium. The workhorse. Page-level conversion rate means very little until you know who arrived.
Is this channel bleeding on mobile? Session source/medium × Device category. A source that looks mediocre in aggregate is often a source that's 80% mobile, on a form that's miserable on mobile.
Is my paid tracking actually working? Landing page × Session campaign. If you're seeing landing pages you never pointed an ad at, or a chunk of campaigns coming back as "(not set)", you don't have a performance problem. You have a tagging problem.
Where is this event really firing? Event name × Page path. The fastest way to catch a tag firing twice, or firing on a template you forgot shared a trigger.
Is this channel acquiring demand or harvesting it? Session default channel group × New vs returning. A channel that looks like a star and turns out to be 90% returning users isn't creating demand. It's taking credit for it.
Why half of these will break
You'll meet a row labelled "(other)". This is the price of admission.
Once you add a secondary dimension you're no longer asking for a row per value, you're asking for a row per combination, and that multiplies fast. GA4 caps how many rows it will process, keeps the top ones by volume, and dumps the rest into a single "(other)" line.
Worth being clear: this is not sampling. A report can show as fully unsampled and still be mostly "(other)". Confusing the two sends people down the wrong path entirely.
Shorter date ranges help. So does avoiding two high-cardinality dimensions in the same view — anything carrying an ID, a raw timestamp, or free text. If it really matters, that's your argument for getting the data into BigQuery.
Not to oversell a little plus sign…
The reason most GA4 installs produce nothing isn't that people haven't found this feature. It's that they open the tool without a question, find a number to feel a way about, and close the tab.
Secondary dimensions are reps in a great habit to build for a marketing analyst – exploring and segmenting averages. Often enough, the blended figure was hiding two groups behaving in completely opposite directions.
The Problem With Averages
Bill Gates walks into a bar. Suddenly, everyone in the bar is a millionaire on average.
Averages have a deceptive feature of bundling data so it describes a pure mathematical average, yet describes nobody in reality.
None of this is new thinking. Avinash Kaushik was saying segment or die back in the Universal Analytics days. His point was that aggregated data doesn’t just hide the answer, it can actively mislead you into acting on a customer who is the average of two people, yet, is actually neither of them.
Nothing in your data is going to be one-dimensional, and no question worth asking about it is either. The skill being built here, is being able to segment averages with enough context to understand them.
Try this in 60 seconds. Take your worst performing landing page. Add session source/medium as a secondary dimension. See whether the story you had in your head about it survives contact with the context from that second column.
Looking for Google Analytics consulting?
Let's find the million-dollar insights hiding in your data.
Let's Talk